
December 28, 2020 / Nirav Shah
As more and more organisations adopt AWS cloud for its obvious benefits, it becomes a known fact that AWS resources need to be monitored. For the same purpose, the most efficient AWS service is CloudWatch.
We can monitor our services like Amazon Web Services like EBS volumes, EC2 instances and RDS instances.
Today we understand about EC2 Monitoring via CloudWatch.
There are two types of monitoring
In CloudWatch default monitoring, it does not enable memory utilization or disk I/O of the instances if we want we need to apply custom metrics for this.
In this blog, we cover how to enable custom detail monitoring and collect memory and disk metrics using AWS CloudWatch agent.
Let’s get started and go step by step.
Step 1: First, we need to create an IAM role with CloudwatchagentServerPolicy
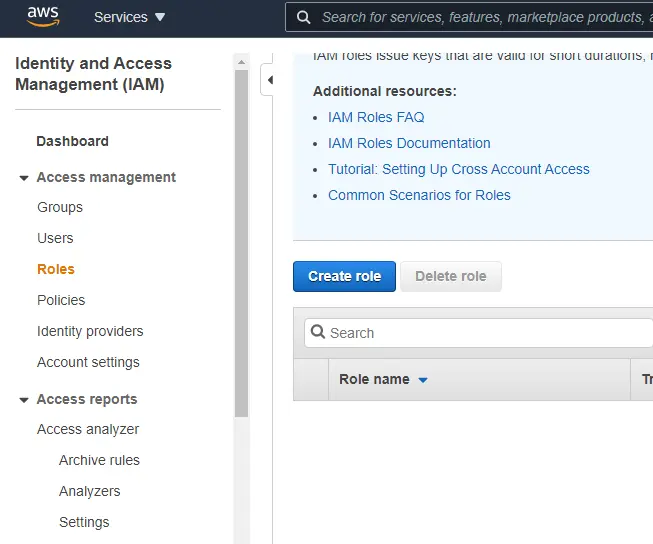
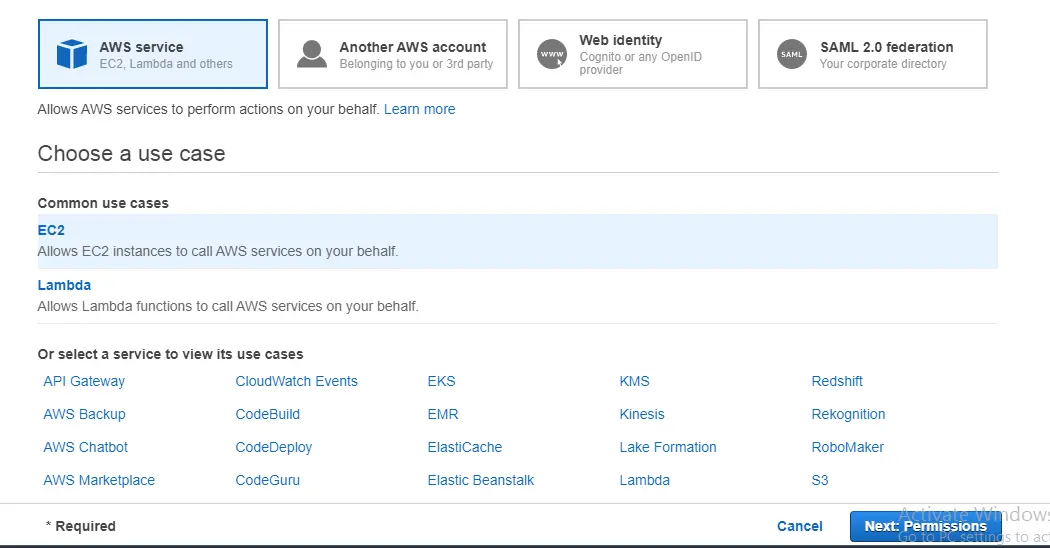
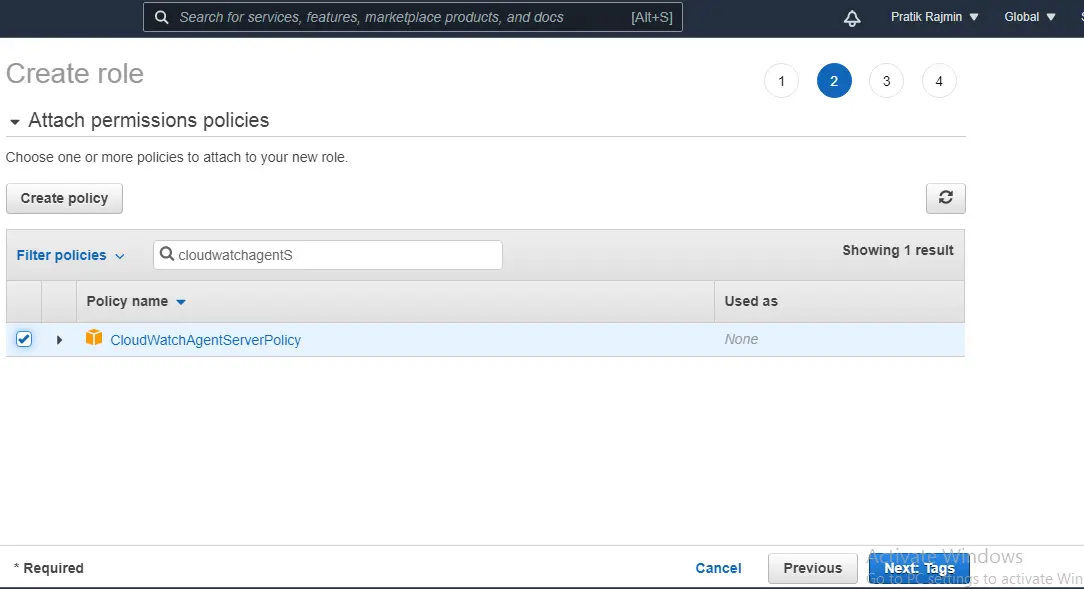
Step 2: Now we need to launch an EC2 Instance with this role. And allow the port for HTTP-80
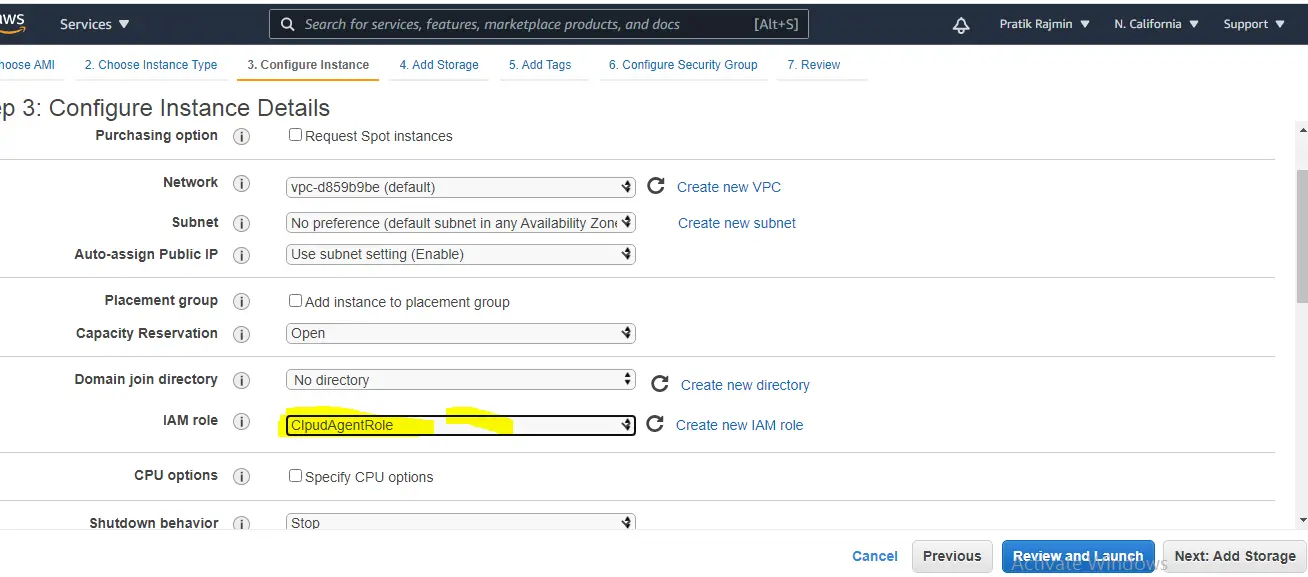
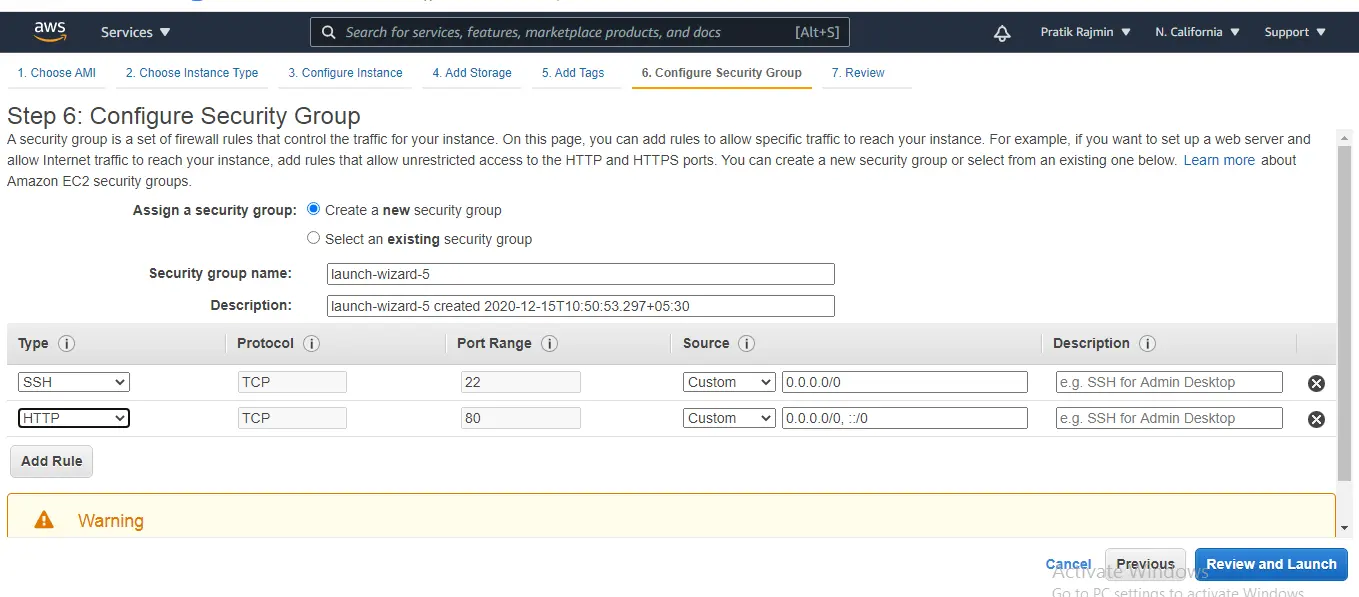
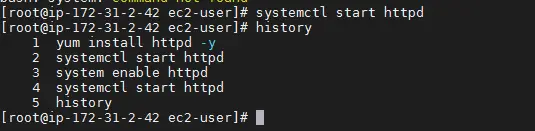
Step 3: Now ssh the EC2 instance and Install httpd package.
    #yum install httpd
    #systemctl start httpd
    #system enable httpd
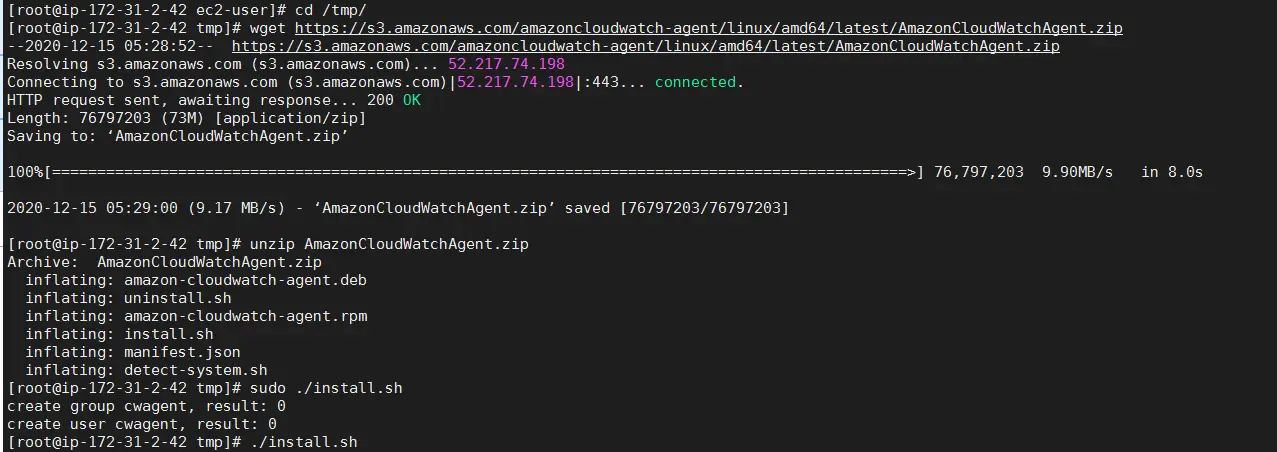
Step 4: Install CloudWatch Agent
CloudWatch agent provides an automated way to send system log data to CloudWatch logs from the EC2 instance
The agent includes the following components:
After installing Agent there are two configurations file created at /etc/awslogs or /var/awslogs/etc directory
#cd /tmp
#wget https://s3.amazonaws.com/amazoncloudwatch-agent/linux/amd64/latest/AmazonCloudWatchAgent.zip
#unzip AmazonCloudWatchAgent.zip
#./install.sh
Step 5: Configure Metrics
In this step, we need to describe the metrics that we want to collect and send to CloudWatch, AWS CloudWatch agent will read that info from a JSON file
#/opt/aws/amazon-cloudwatch-agent/bin/amazon-cloudwatch-agent-config-wizard
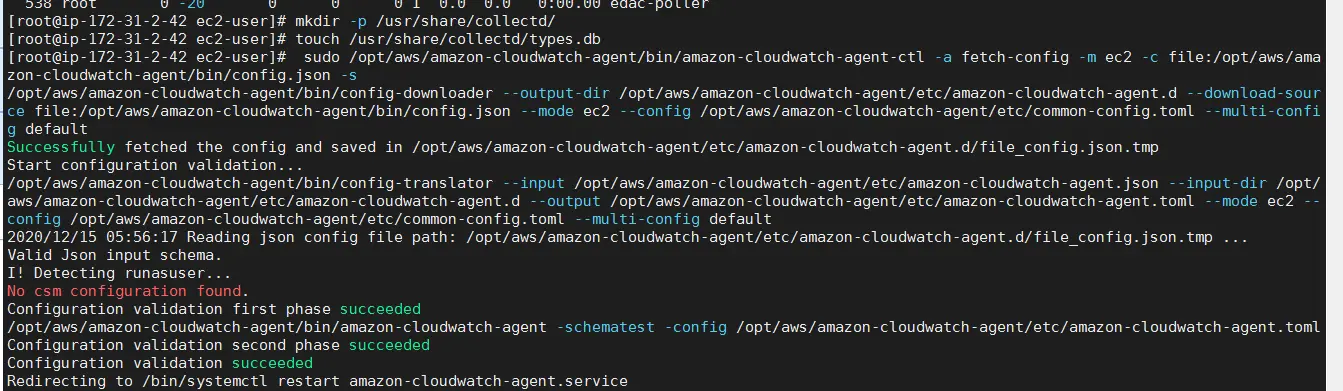
Step 6: Start Cloudwatch agent
#mkdir -p /usr/share/collectd
#touch /usr/share/collectd/types.db
#/opt/aws/amazon-cloudwatch-agent/bin/amazon-cloudwatch-agent-ctl -a fetch-config -m ec2 -c file:/opt/aws/amazon-cloudwatch-agent/bin/config.json -s
# /bin/systemctl restart amazon-cloudwatch-agent.service
#/bin/systemctl status amazon-cloudwatch-agent.service
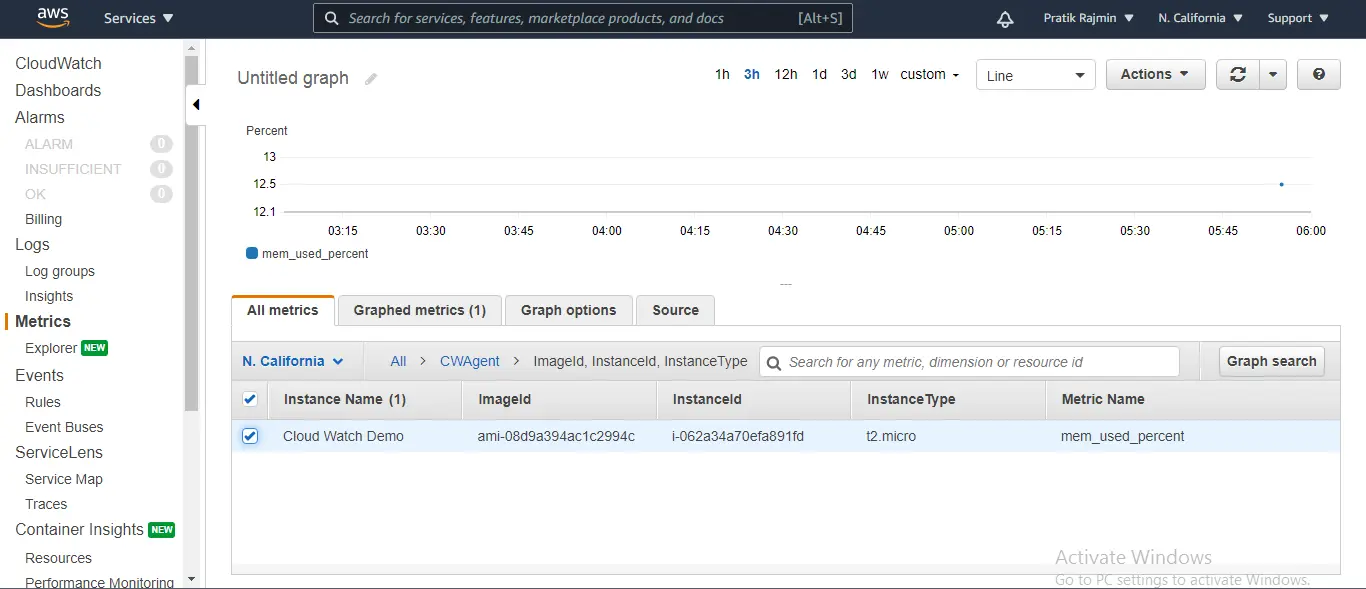
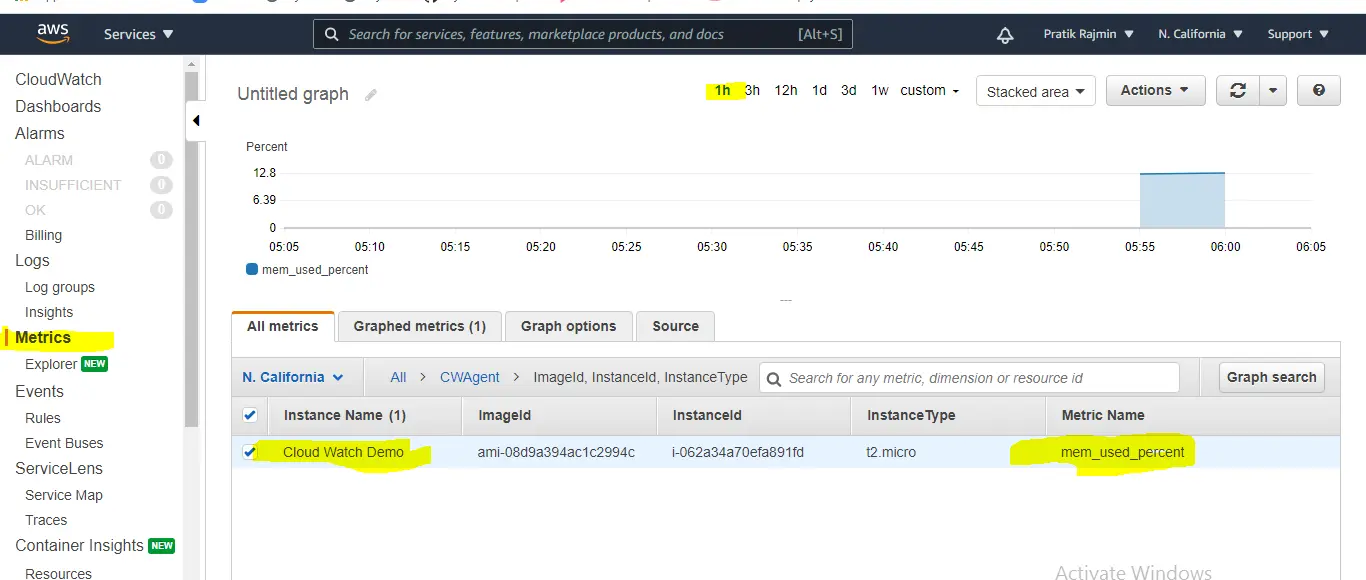
Step 7: Now Create Cloudwatch Dashboard
We can see memory utilization from here
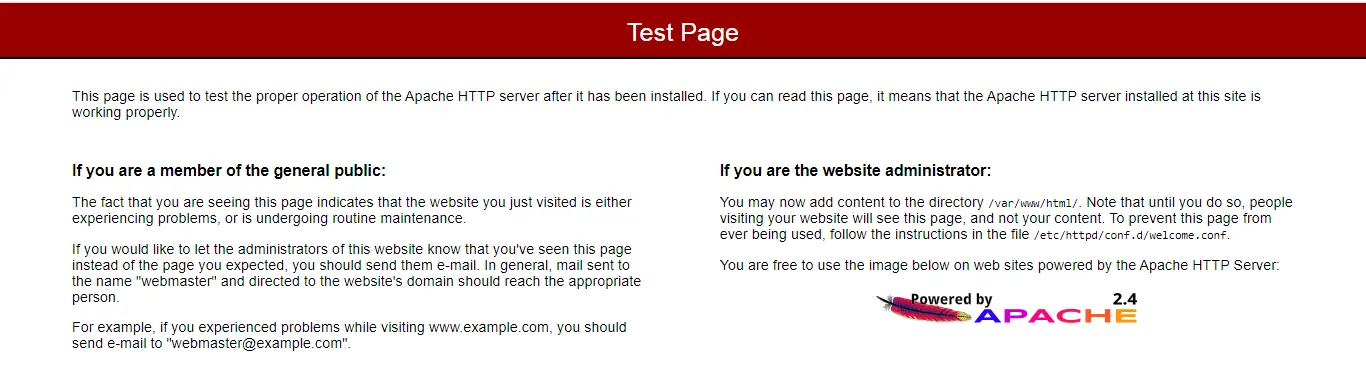
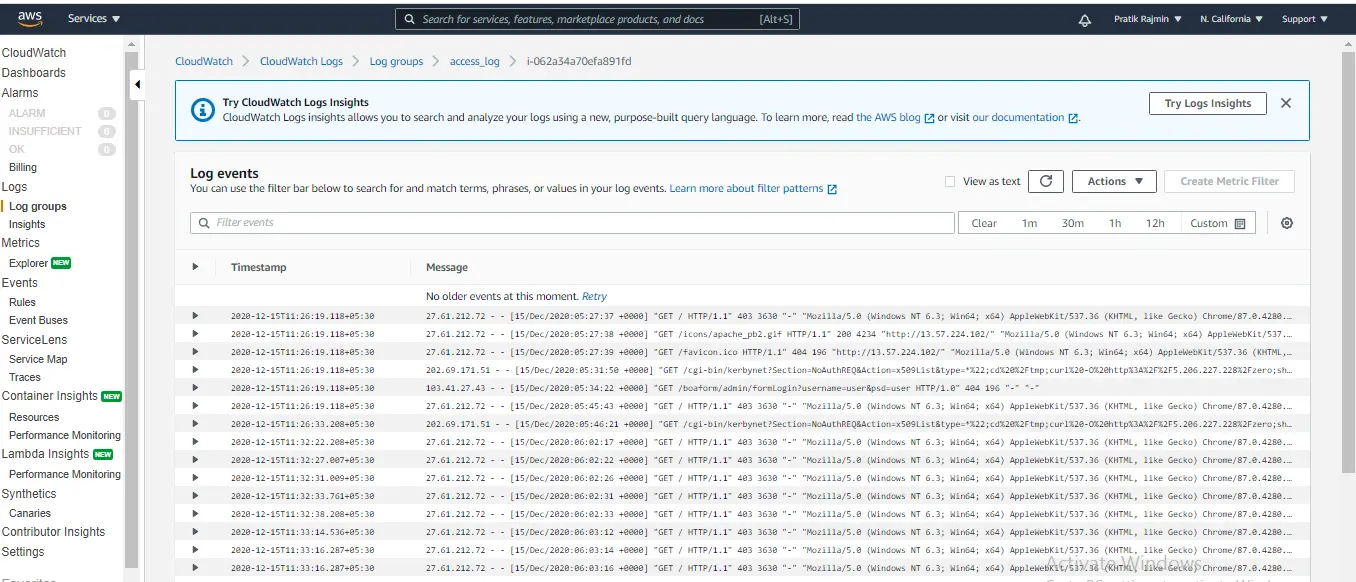
Hit access webpage and see the log
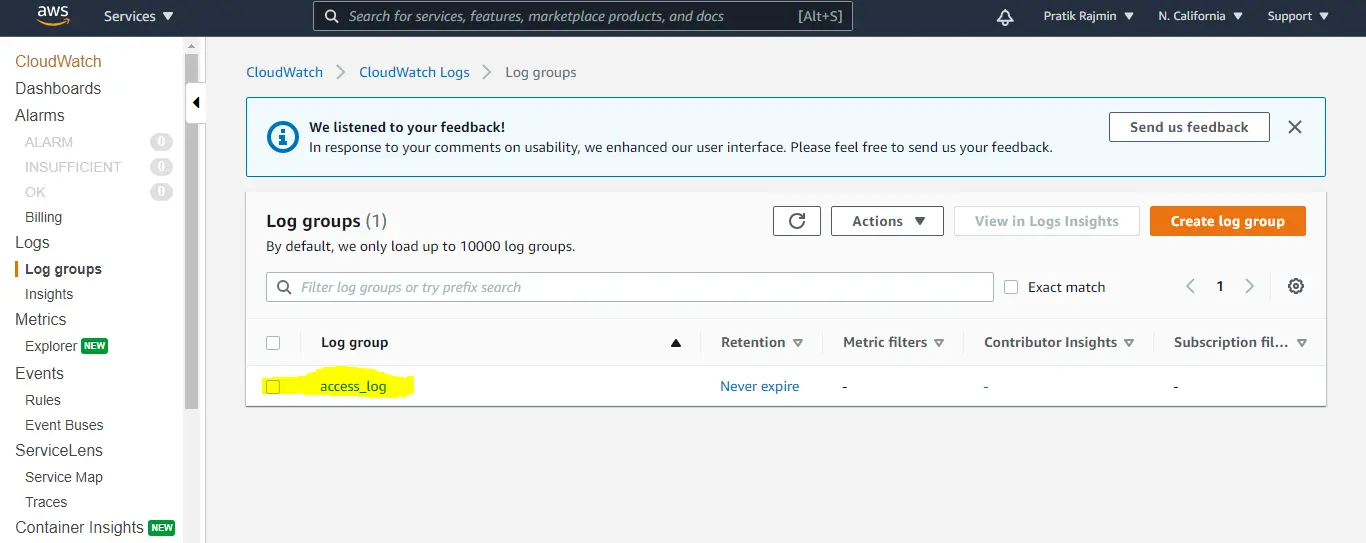
We can see our log here
Conclusion
By this, we can create a custom log for the AWS EC2 instance and the same method can be used with other AWS services to gather data and attain valuable insights.
Thanks!! and stay tuned for more blogs.
Also Read –How To Start And Stop AWS EC2 Instance Using Lambda


Nirav Shah is the Director of Eternal Web Pvt Ltd, an AWS Advanced Consulting Partner and certified Odoo Partner based in the UK. With over a decade of experience in cloud computing, digital transformation, and ERP implementation, Nirav helps enterprises adopt the right technology to solve complex business challenges. He specialises in AWS infrastructure, Odoo ERP, and web development solutions for businesses across the UK and beyond.
Have queries about your project idea or concept? Please drop in your project details to discuss with our AWS Global Cloud Infrastructure service specialists and consultants.